
September Market Pulse - What are we watching?

“You can’t predict. You can prepare.” — Howard Marks
We have seen through tough times in the last month, and we have been watching some data points that makes us bullish on equities at this point in time.

Since the time we have market data (1990), we see that there is some or the other bad news every year and very bad news once every 3 years.

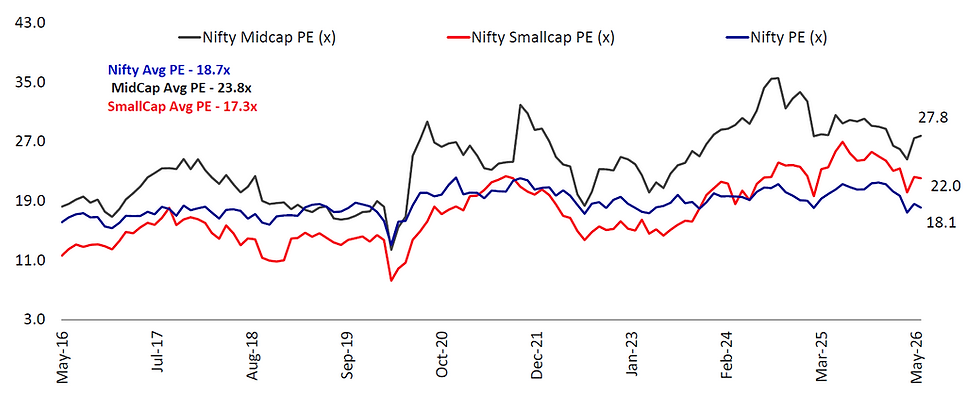
What is interesting to note is where we are sitting on the Nifty 50 Price-to-Book ratio today, which has gone below 3 for the first time since 2020. If you see the above heatmap carefully, Nifty 50 P/B has only gone below 3 in years where we have seen a year of very bad news, as mentioned above, which was followed by an economic slowdown. This, coupled with Nifty P/E below 20, makes Nifty 50/Large Caps a real value buy as of today.

Past data suggests that 75% of the time, Indian equities have doubled in less than 6 years. To give you context, a 15% CAGR for 5 years doubles your money. 25% of the time, Nifty has doubled in less than 3 years, so we are sitting at a stage where these probabilities look highly possible.

The above valuation meter takes into account 4 parameters to find out the current valuations; this is a mix of an equal-weighted composite of Market Cap to GDP, Price to Earnings (P/E), Price to Book (P/B) and Bond Yield to Earnings Yield. We have reached the Attractive Zone as of this month since this meter was last calculated as of August end, after which we have seen some more correction. Going into the Very Attractive Zone is almost impossible to predict, and hence we are comfortable with valuations as on date.

If you see, when we enter the Attractive Zone, the probability of returns>10% is a staggering 96%, while that of returns>12% is still 90%, while more than 15% is at 40%. Considering the 90% probability that you will still clock 12% returns is not a bad deal, and hence it feels more comfortable than it did last month to invest today.

This is something we have always heard from big investors on TV shows or in newspaper articles: that market returns always chase earnings; what has happened in the last 5 years is that BSE Sensex cos earnings growth has been ~13% while Sensex has just given ~7%, so there is an additional 5% that is to catch up, which we believe will happen with time. This too we have seen repeating time and again in the past.

As per estimates by Bajaj Finserv AMC and Avendus Spark, 15% earnings growth is expected over the next 2 years in BSE 500 cos, which again implies that there’s a lot of catching up for the market to do.

We have seen massive outflows by FIIs in the last 2 years, and this has made it come to their lowest levels in a decade. Will they be back? Definitely, they always do and with the kind of consistent earnings that we have seen above, they will be back sooner than later.

We have seen this during past crisis events: FII outflows were often followed by strong equity returns; most of the time, these have been massive, going as high as 127% after the 2008-09 GFC deluge.

Another important data point to note is that promoter buying has increased in the last 2 quarters, and we have seen a similar trend during (very)bad times in the past. Imagine you are the owner of the company and you know that the value of your company on the market is lower than what it should be; what will you do? Obviously, buy it from the market at a lower price and then benefit from it eventually.

In the last 2 years, the market has been disappointing, given you flat to negative returns depending on when you entered the market. This is something common with most investors today, especially those who entered in the last 3 years.

The good news is, if you have continued investing during these difficult times, you have probably got more units at a lower price in your mutual fund portfolio, or you have averaged your stocks at a good price. The probability that they will pay off handsomely in the next 3-5 years is pretty high. If you see the above table, it shows periods during which Nifty has given flat to negative returns in 2 years, which has been followed by a good cycle for the next 5 years.

Last one for today: here we see periods of rupee depreciation, and what happened in the next 3 years. In the last year, we have seen the rupee depreciate by around ~15%. Similar instances in the past where we saw a similar trend: 3-year returns have been 20%+ CAGR most of the time, but even the lowest has been ~14%, which is not bad at all.
All we are saying is that the odds of you winning from here are high; the data says so, and that too, lots of such data.
Have money waiting on the sidelines?
If you’re unsure whether to invest now, stagger your investments, or simply continue with your existing SIPs, speak to us.
We’ll help you decide how to deploy your money based on your portfolio and goals rather than trying to predict the next market move.
Talk to Sage Capital → https://calendly.com/sage-capital/poreview
Like our perspective?
Subscribe to Sage Capital’s Market Pulse for our monthly market views and investment insights.
And if you found this article useful,
share it with someone who has been feeling frustrated with equity returns over the last couple of years.
Thank you for being part of the Sage Capital community.
Warm Regards,
Nikhil Gupta
Helping investors build wealth with clarity, discipline, and patience.
AMFI Registered MFD
ARN-177251


Comments